Execution Details
On the left side you can see the request JSON and the inputs you provided to the execution. On the right side you can see the JSON output, along with Markdown and Form views where applicable. The JSON output lets you quickly verify correctness, and displays bounding box accuracy if grounding was applied to the input.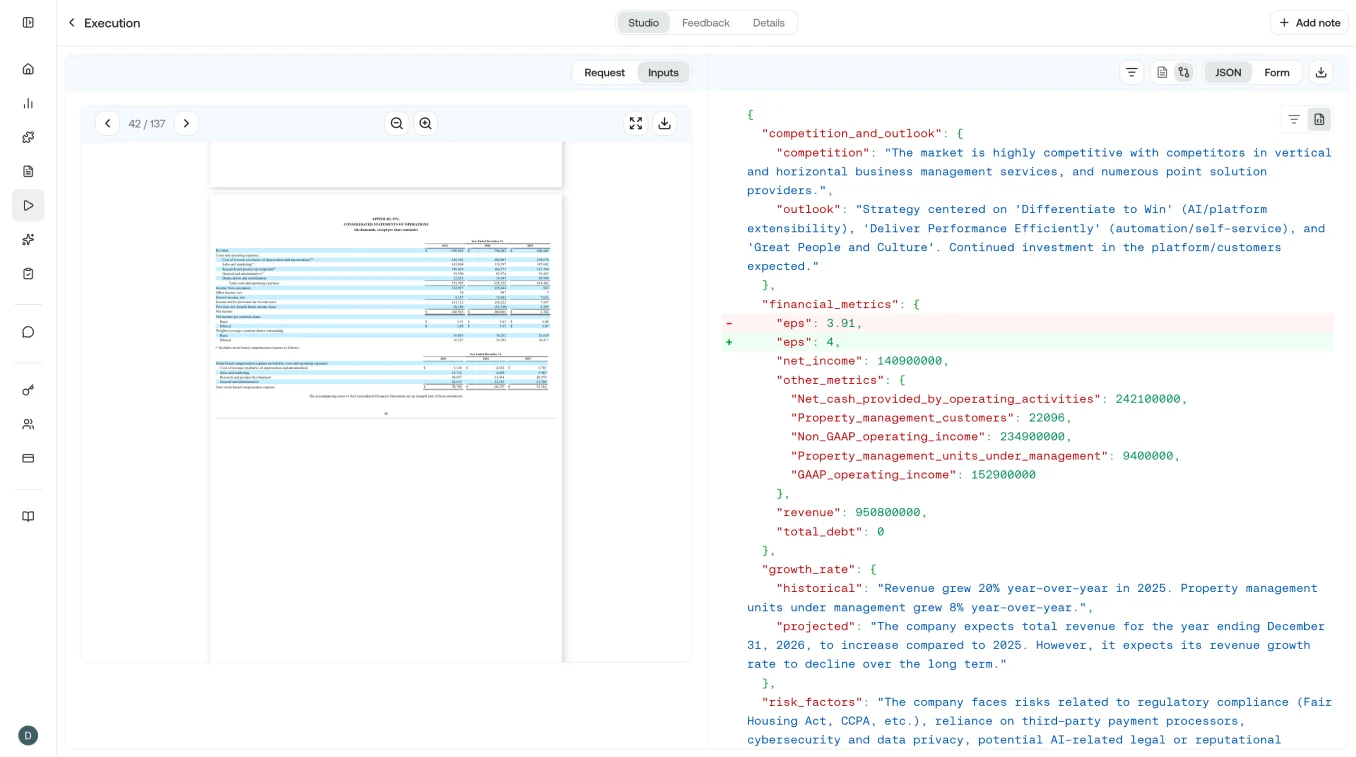
JSON Form
The JSON Form tab switches the right panel to a structured view that lets you provide field-level feedback on the execution. For example, if you’re analyzing a 10-K and the EPS value is incorrect, you can update it and click save.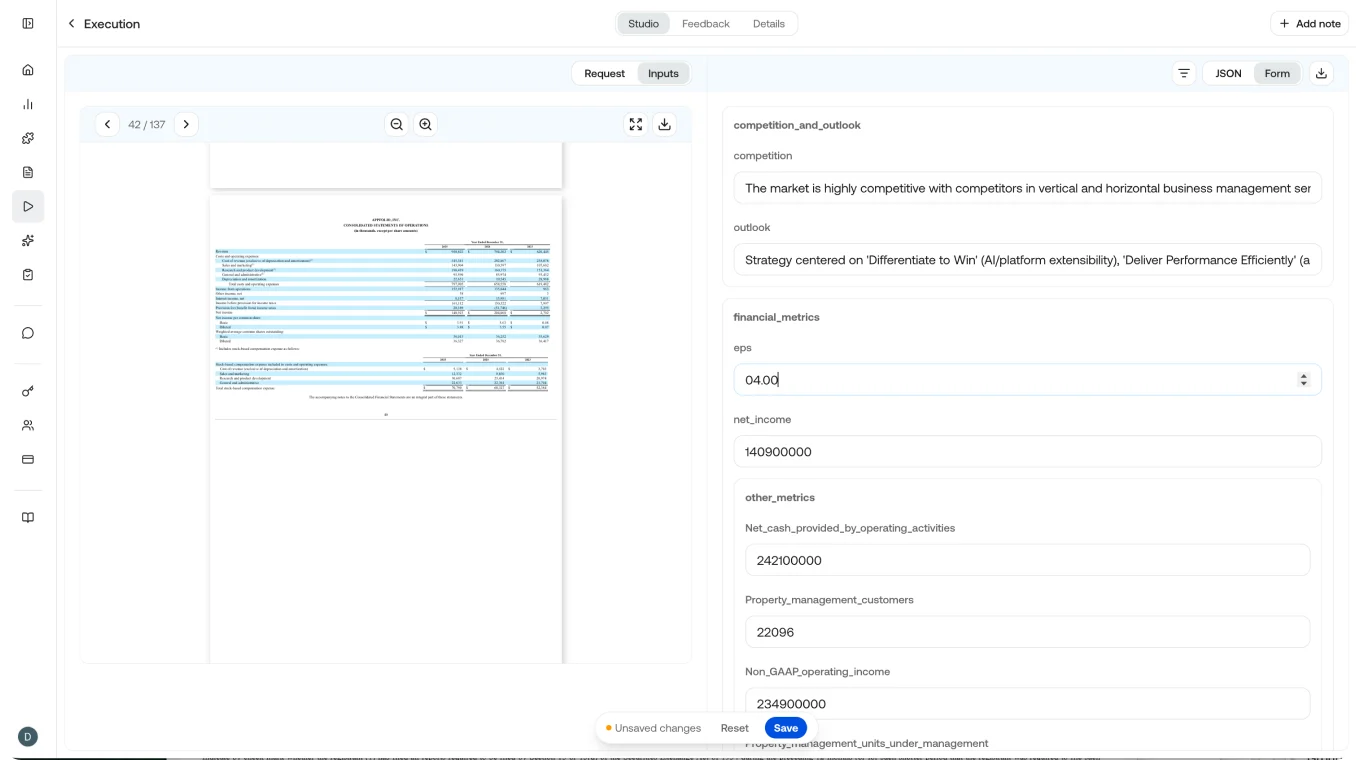
Diff View
Once feedback is provided, you can view a diff by clicking JSON and then the diff icon to its left. This makes it easy to scan and understand the changes made through feedback.
Execution Feedback
If you don’t need field-level feedback, you can provide execution-level feedback by clicking the note button in the top right of the view.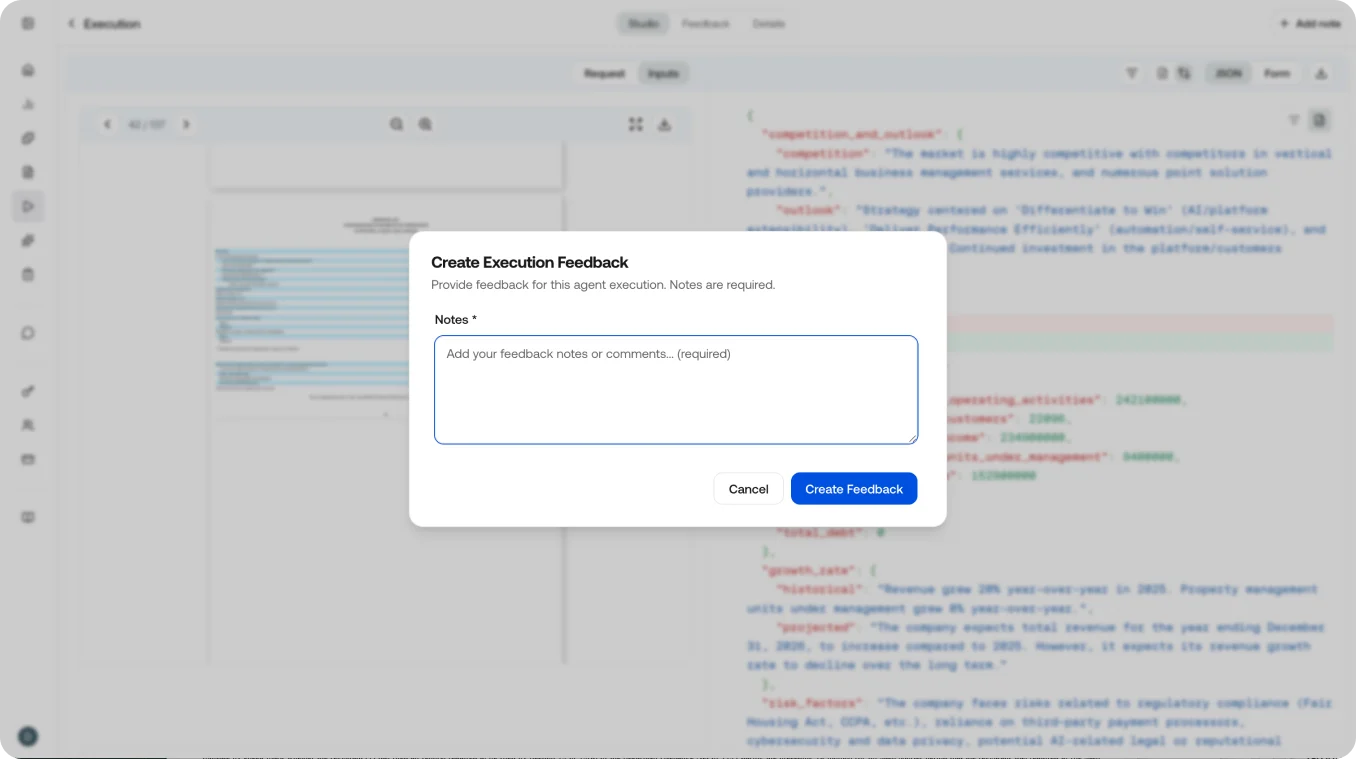
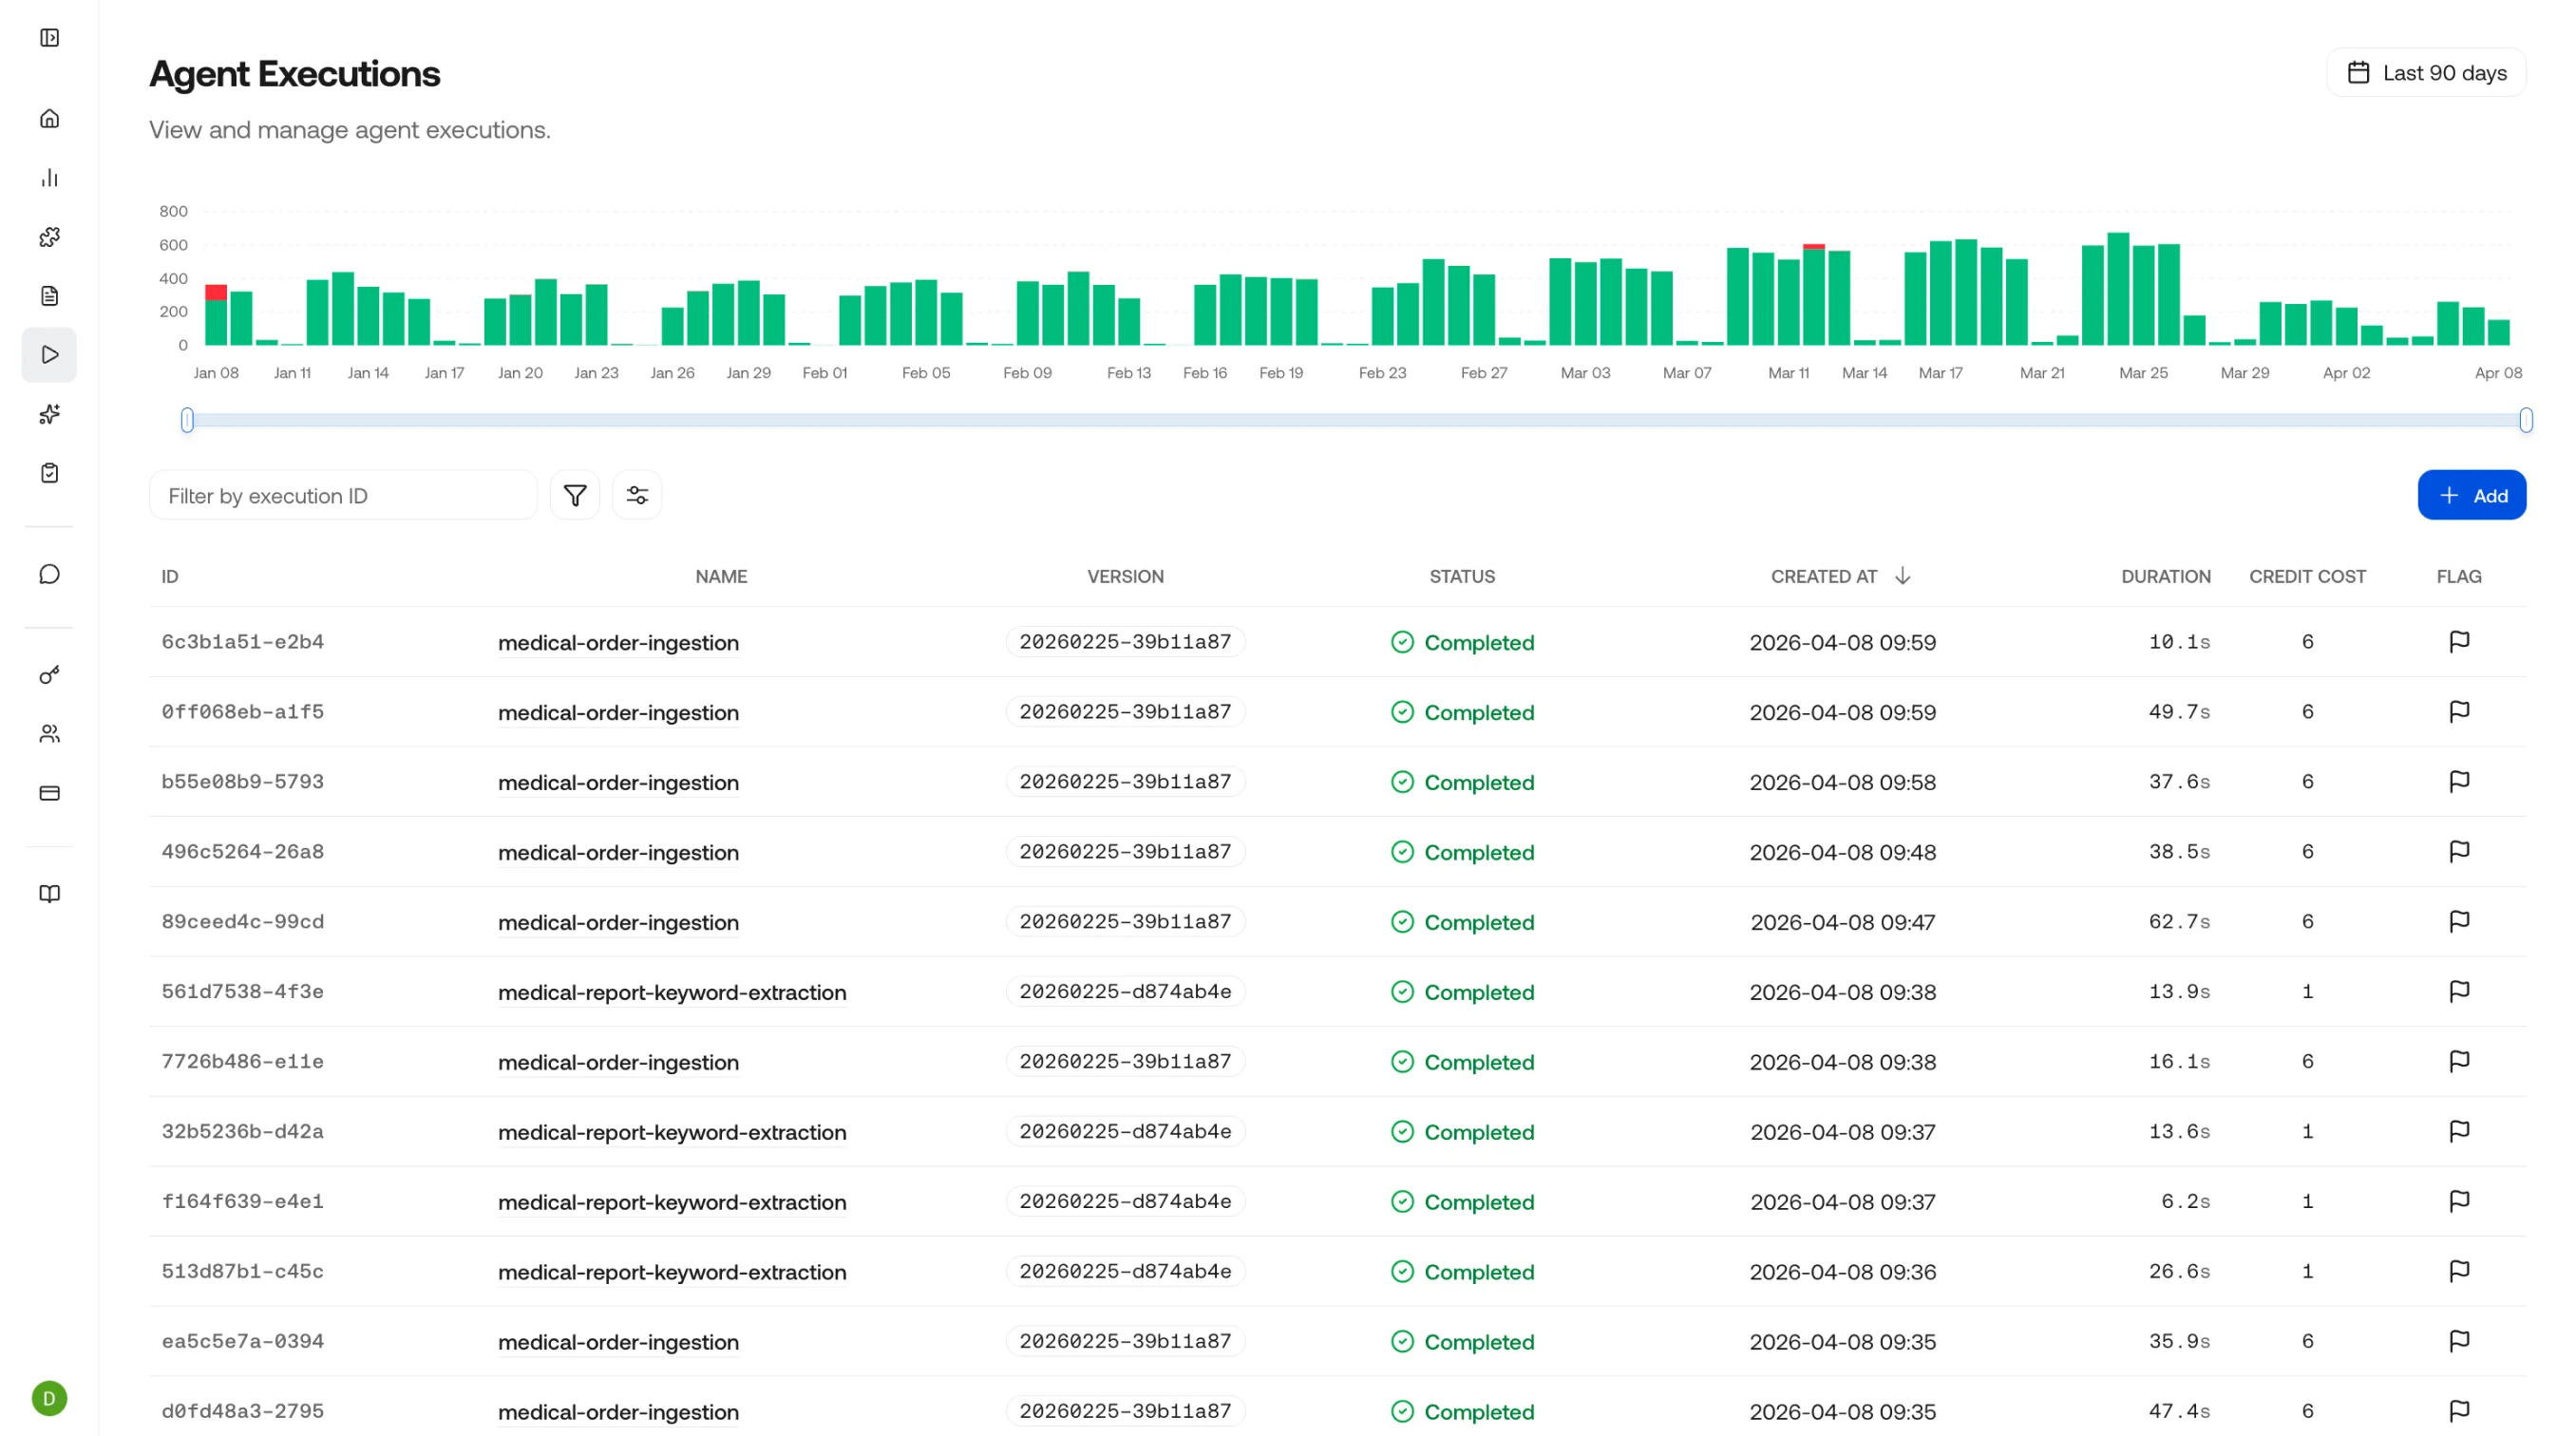
Executions Table
Filter by agent, skill, status, or time range. Sort by duration or credits to find outliers.
Single vs. Batch Executions
The platform supports both:- Single executions: One file, one skill, one result. Ideal for interactive use and testing.
- Batch executions: Process multiple files in a single run. The executions table shows the batch as a group, and you can expand it to see individual results.
Debugging Failures
When an execution fails, the detail view shows:- Which step failed: Highlighted in the timeline
- Error message: The specific error returned by the model or tool
- Input that caused the failure: The exact payload that triggered the error
- Preceding successful steps: Context for what worked before the failure
Related Pages
Observe Overview
Return to the observability dashboard.
Requests
View individual API request logs.
Execute an Agent (API)
Trigger agent executions programmatically.
Artifacts
Understand the artifacts produced by executions.