VLM-1 x MongoDB integration.

Re-imagining ETL for Visual Content with VLM-1 and MongoDB

As businesses amass ever-growing troves of unstructured customer data - including documents, PDFs, images, videos, and audio files - the challenge of extracting meaningful insights from this “dark data” has become increasingly critical. Traditional database approaches simply cannot handle the complexity and diversity of multi-modal enterprise content.

Vector search technologies have emerged as one of the first solutions, allowing organizations to embed and index these varied data sources en masse. This enables users to retrieve relevant files based on natural language queries, akin to the Retrieval Augmented Generation (RAG) workflow. However, this represents only the first step in realizing the full potential of multi-modal data.

Embeddings are not Enough

While vector search provides a valuable coarse-grained retrieval capability, it has inherent limitations. Condensing an entire document or multiple paragraphs into a single vector representation often fails to capture the nuanced content and context that enterprise users require. Extracting precise information - such as a specific sales figure, the author of a report, or the insights contained in a data visualization - remains a significant challenge. Overcoming this requires more sophisticated indexing and analysis approaches that can parse the diverse modalities within enterprise data.

Transforming Visual Content with VLM-1

We believe Visual Language Models (VLMs) hold the key to unlocking the true value of enterprise visual content. Enter VLM-1 - our highly specialized Vision Language Model that empowers organizations to accurately extract structured data from diverse visual sources such as images, documents, and presentations. This breakthrough capability, which we call ETL for visual content, allows businesses to seamlessly process and index unstructured visual data, transforming raw multi-modal information into valuable, queryable insights.

Here’s an example of a slide from a financial presentation and the structured JSON output that VLM-1 can extract:

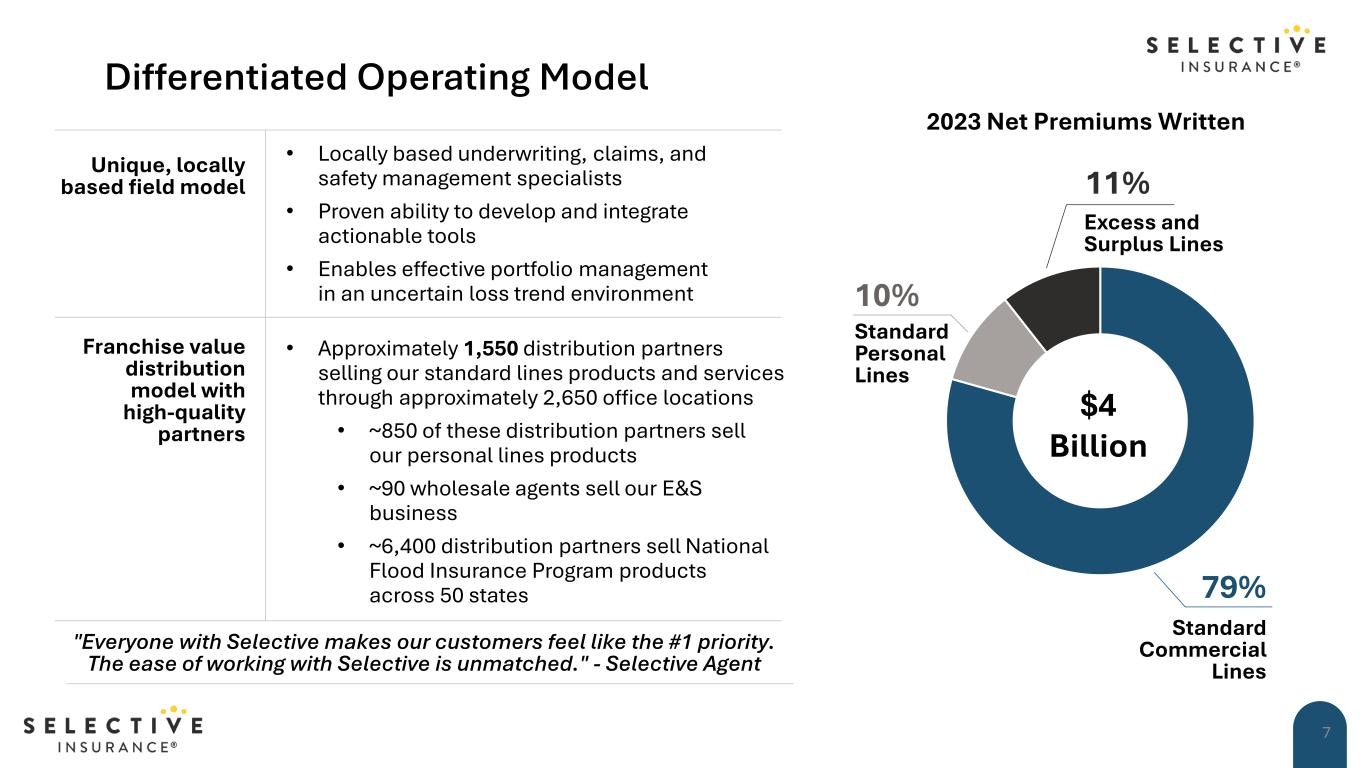
Sample image from a financial presentation.

{
  "title": "Differentiated Operating Model",
  "page_number": 7,
  "description": "The slide presents a 'Differentiated Operating Model' for Selective Insurance, detailing their unique field model, franchise value, and distribution network. It also includes a pie chart showing the 2023 Net Premiums Written, with a total of $4 Billion distributed across different lines of insurance.",
  "charts": [
    {
      "type": "pie",
      "title": "2023 Net Premiums Written",
      "description": "A pie chart showing the distribution of net premiums written by Selective Insurance in 2023, totaling $4 Billion. It is divided into three categories: Standard Commercial Lines (79%), Standard Personal Lines (10%), and Excess and Surplus Lines (11%).",
      "data": "| Category | Percentage | \n| --- | --- | \n| Standard Commercial Lines | 79% | \n| Standard Personal Lines | 10% | \n| Excess and Surplus Lines | 11% |",
      "caption": null
    }
  ],
  "tables": null,
  "others": [
    {
      "data": "### Unique, locally based field model\n- Locally based underwriting, claims, and safety management specialists\n- Proven ability to develop and integrate actionable tools\n- Enables effective portfolio management in an uncertain loss trend environment\n\n### Franchise value distribution model with high-quality partners\n- Approximately 1,550 distribution partners selling our standard lines products and services through approximately 2,650 office locations\n  - ~850 of these distribution partners sell our personal lines products\n  - ~90 wholesale agents sell our E&S business\n  - ~6,400 distribution partners sell National Flood Insurance Program products across 50 states\n\n> \"Everyone with Selective makes our customers feel like the #1 priority. The ease of working with Selective is unmatched.\" - Selective Agent",
      "caption": null,
      "title": null
    }
  ]
}

Given this JSON output, enterprises can now easily store and query the extracted structured data alongside the raw visual content from their favorite document DB, enabling a wide range of use cases such as content discovery, business intelligence, and analytics.

Pairing VLM-1 with a Flexible Data Platform

To fully capitalize on the power of VLM-1, enterprises require a data platform that can handle the scale, diversity, and flexible schema of the extracted visual insights. This is where a modern, document-oriented NoSQL database like MongoDB excels. MongoDB’s support for JSON-like documents and flexible schema make it an ideal complement to VLM-1. By storing the structured data extracted from visual content directly in MongoDB, organizations can seamlessly query and analyze this information alongside their other multi-modal business data. The managed MongoDB Atlas platform further enhances this integration, providing enterprise-grade reliability, scalability, and ease of use.

MongoDB: The Perfect Fit for VLM-1

MongoDB is a document-oriented NoSQL database that supports JSON-like documents utilizing a flexible schema. It is designed for scalability, flexibility, and performance, making it a popular choice for modern applications incorporating a lot of unstructured and multi-modal data. Since VLM-1 can extract structured JSON from visual content, MongoDB and the managed MongoDB Atlas platform are a natural fit for storing and querying this structured data.

Get Started with VLM-1 and MongoDB

If you’re eager to experience the transformative potential of VLM-1 and MongoDB, we’ve created a step-by-step Colab notebook that walks through the integration process. Dive in and see how you can elevate your enterprise’s visual content into a strategic advantage.