> ## Documentation Index
> Fetch the complete documentation index at: https://docs.vlm.run/llms.txt
> Use this file to discover all available pages before exploring further.
# Observe
> Full observability for your visual AI: requests, executions, completions, and usage metrics
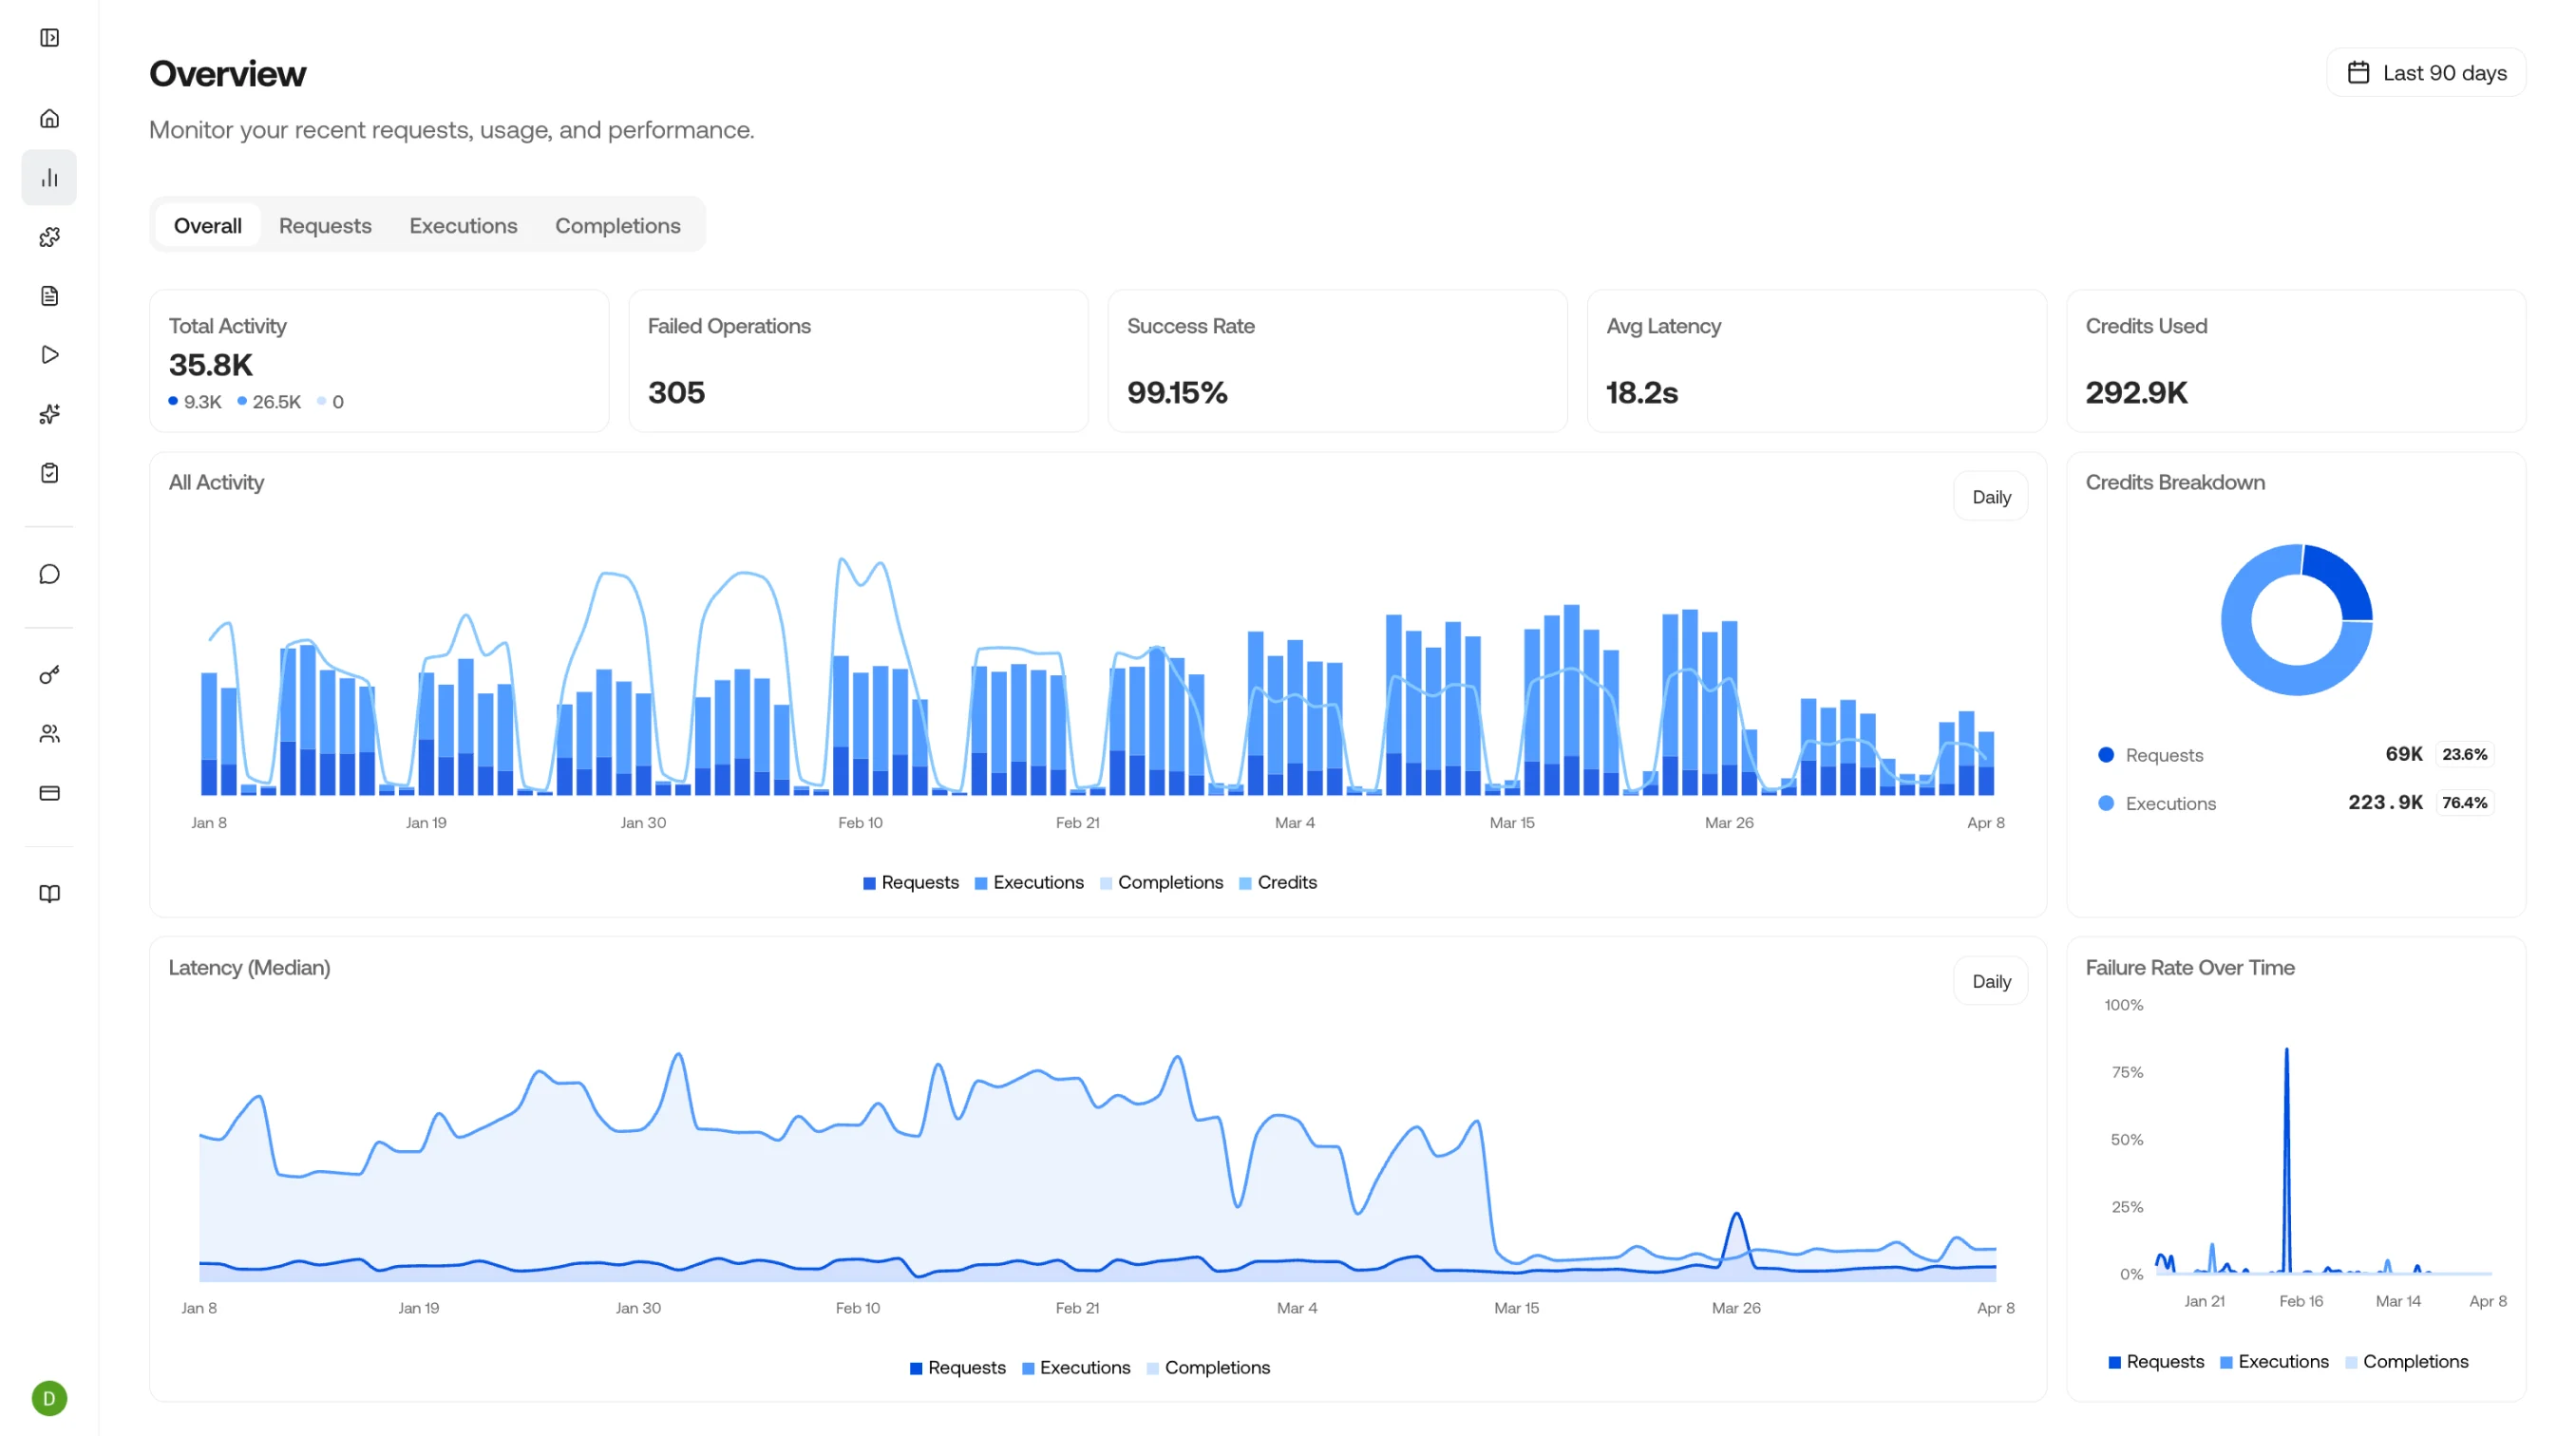
The Overview dashboard gives you a real-time look at your VLM Run platform usage, including total activity, success rate, average latency, and credits used. Track requests, executions, and completions to monitor performance over time.
Everything you see here is also available through the API. See the [API reference](/api-reference/index) to query requests, executions, and completions programmatically.
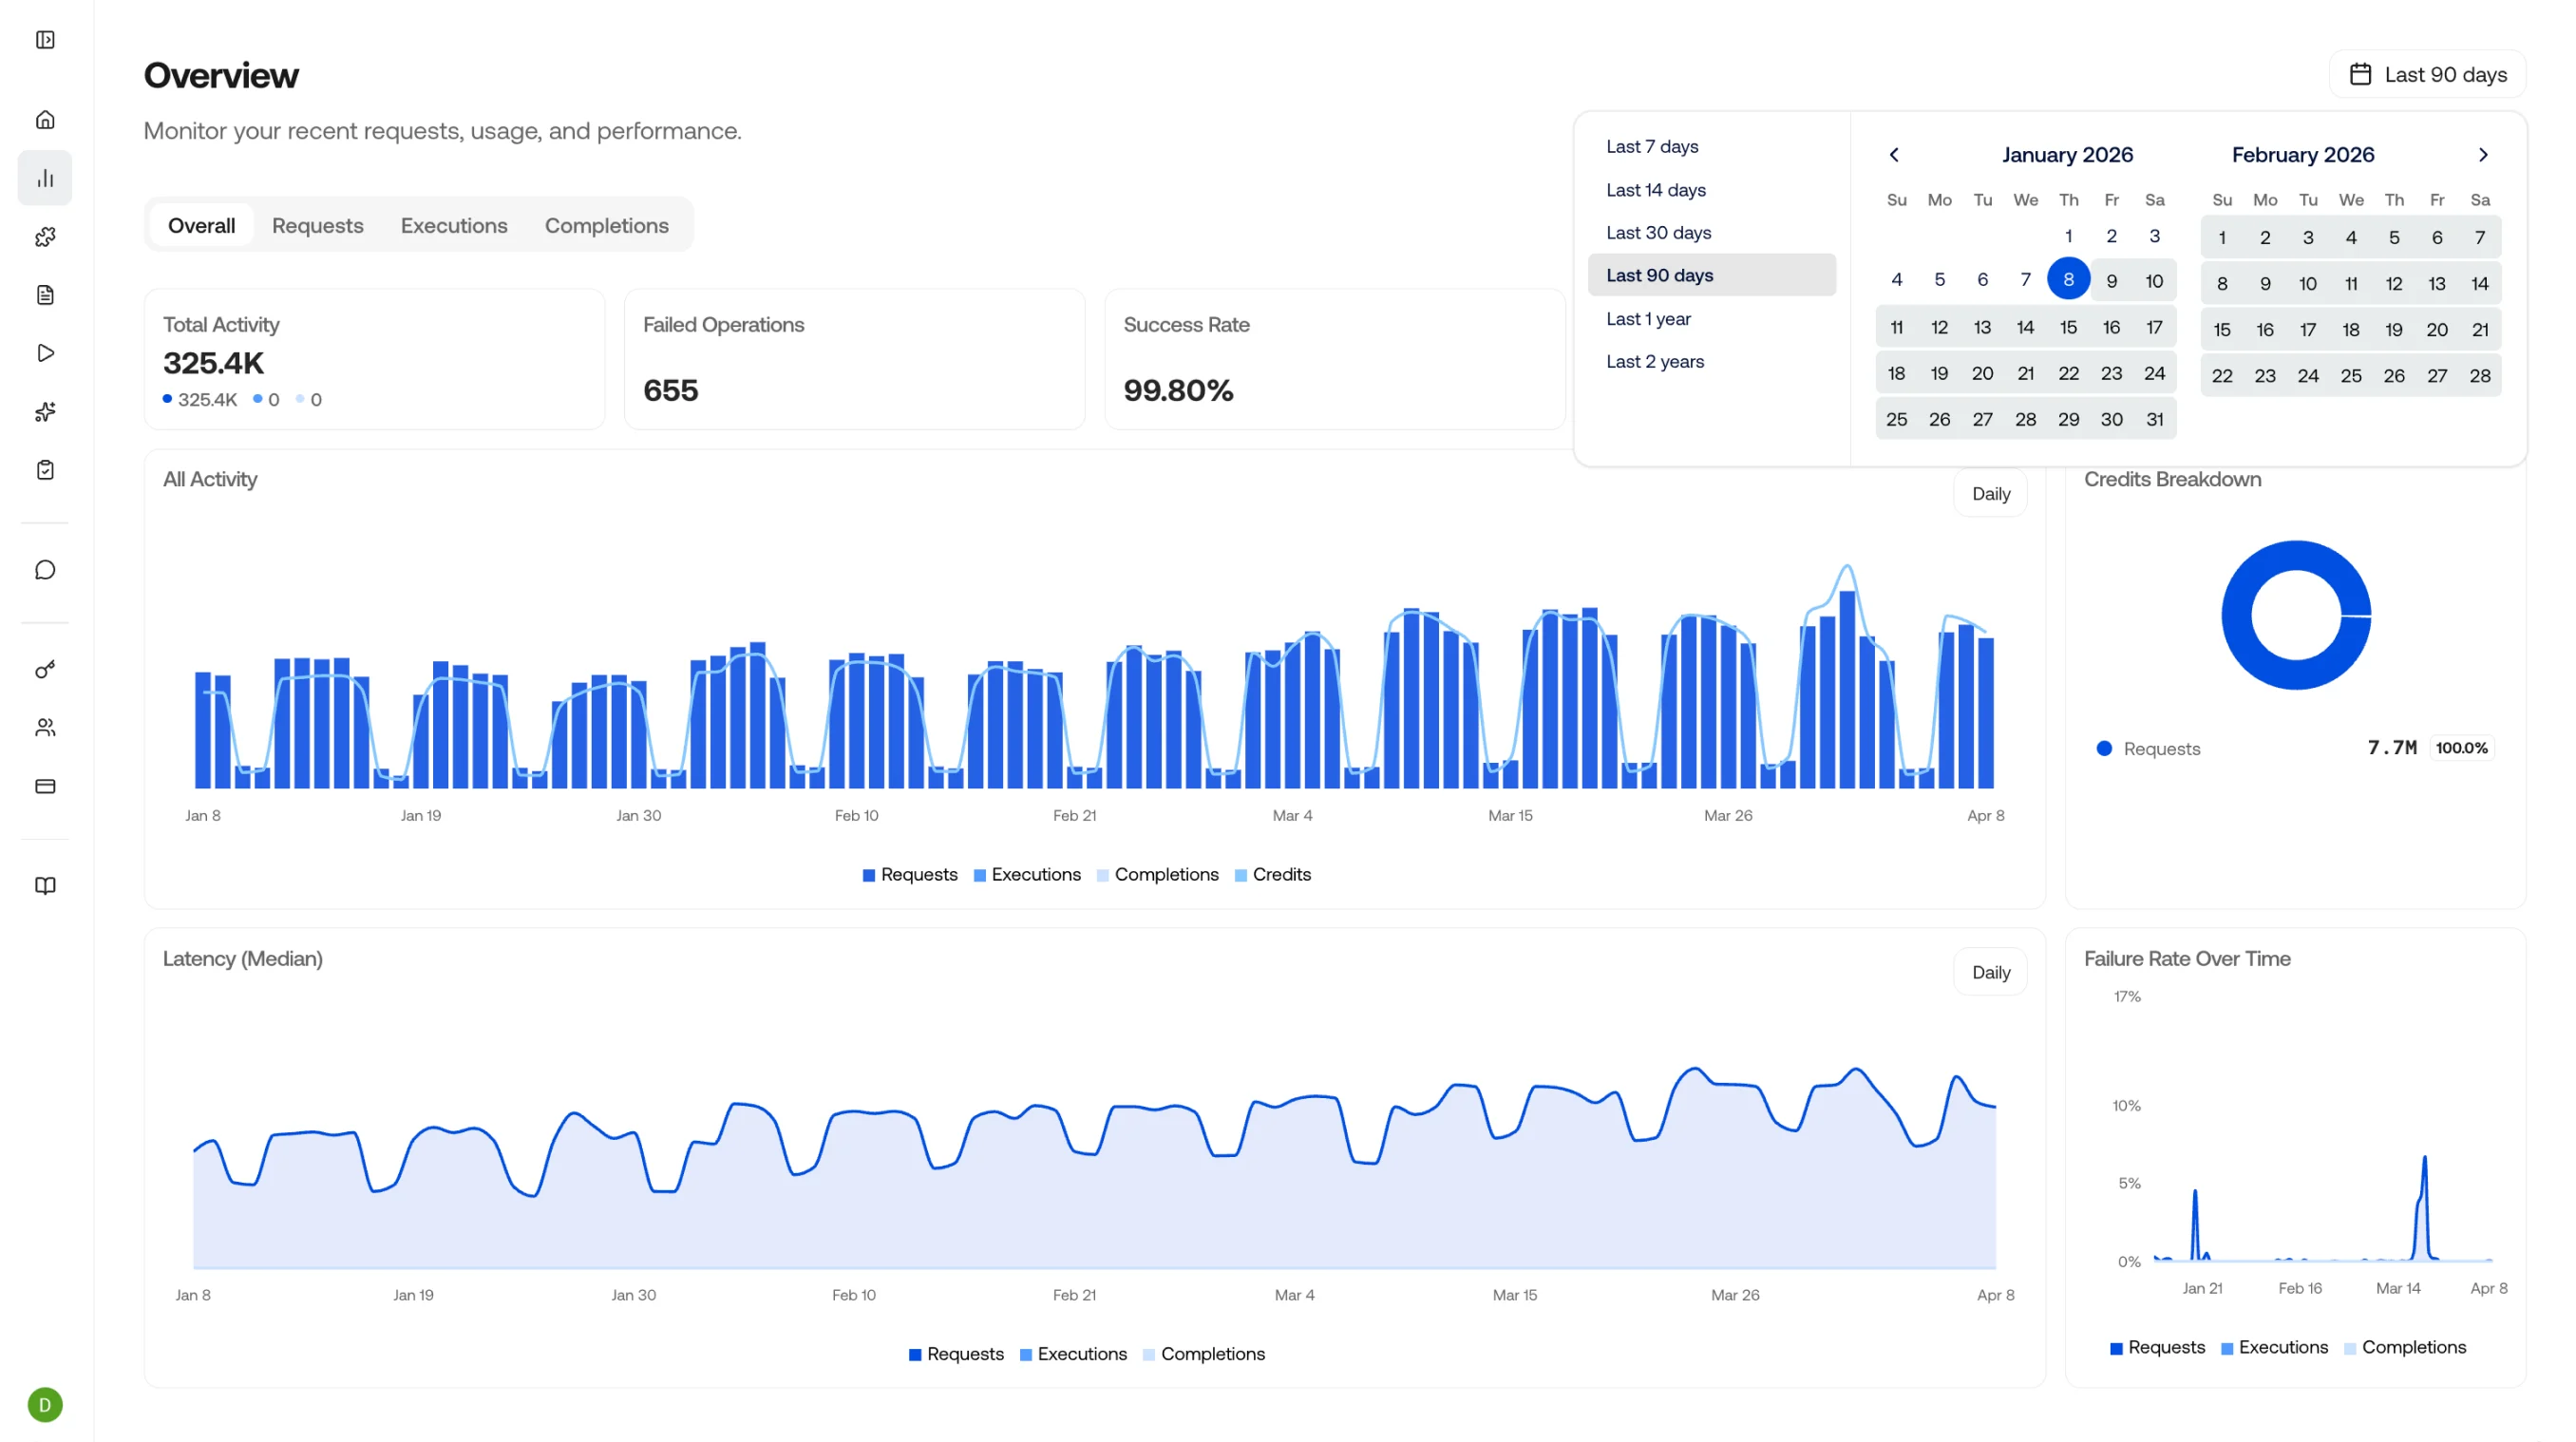
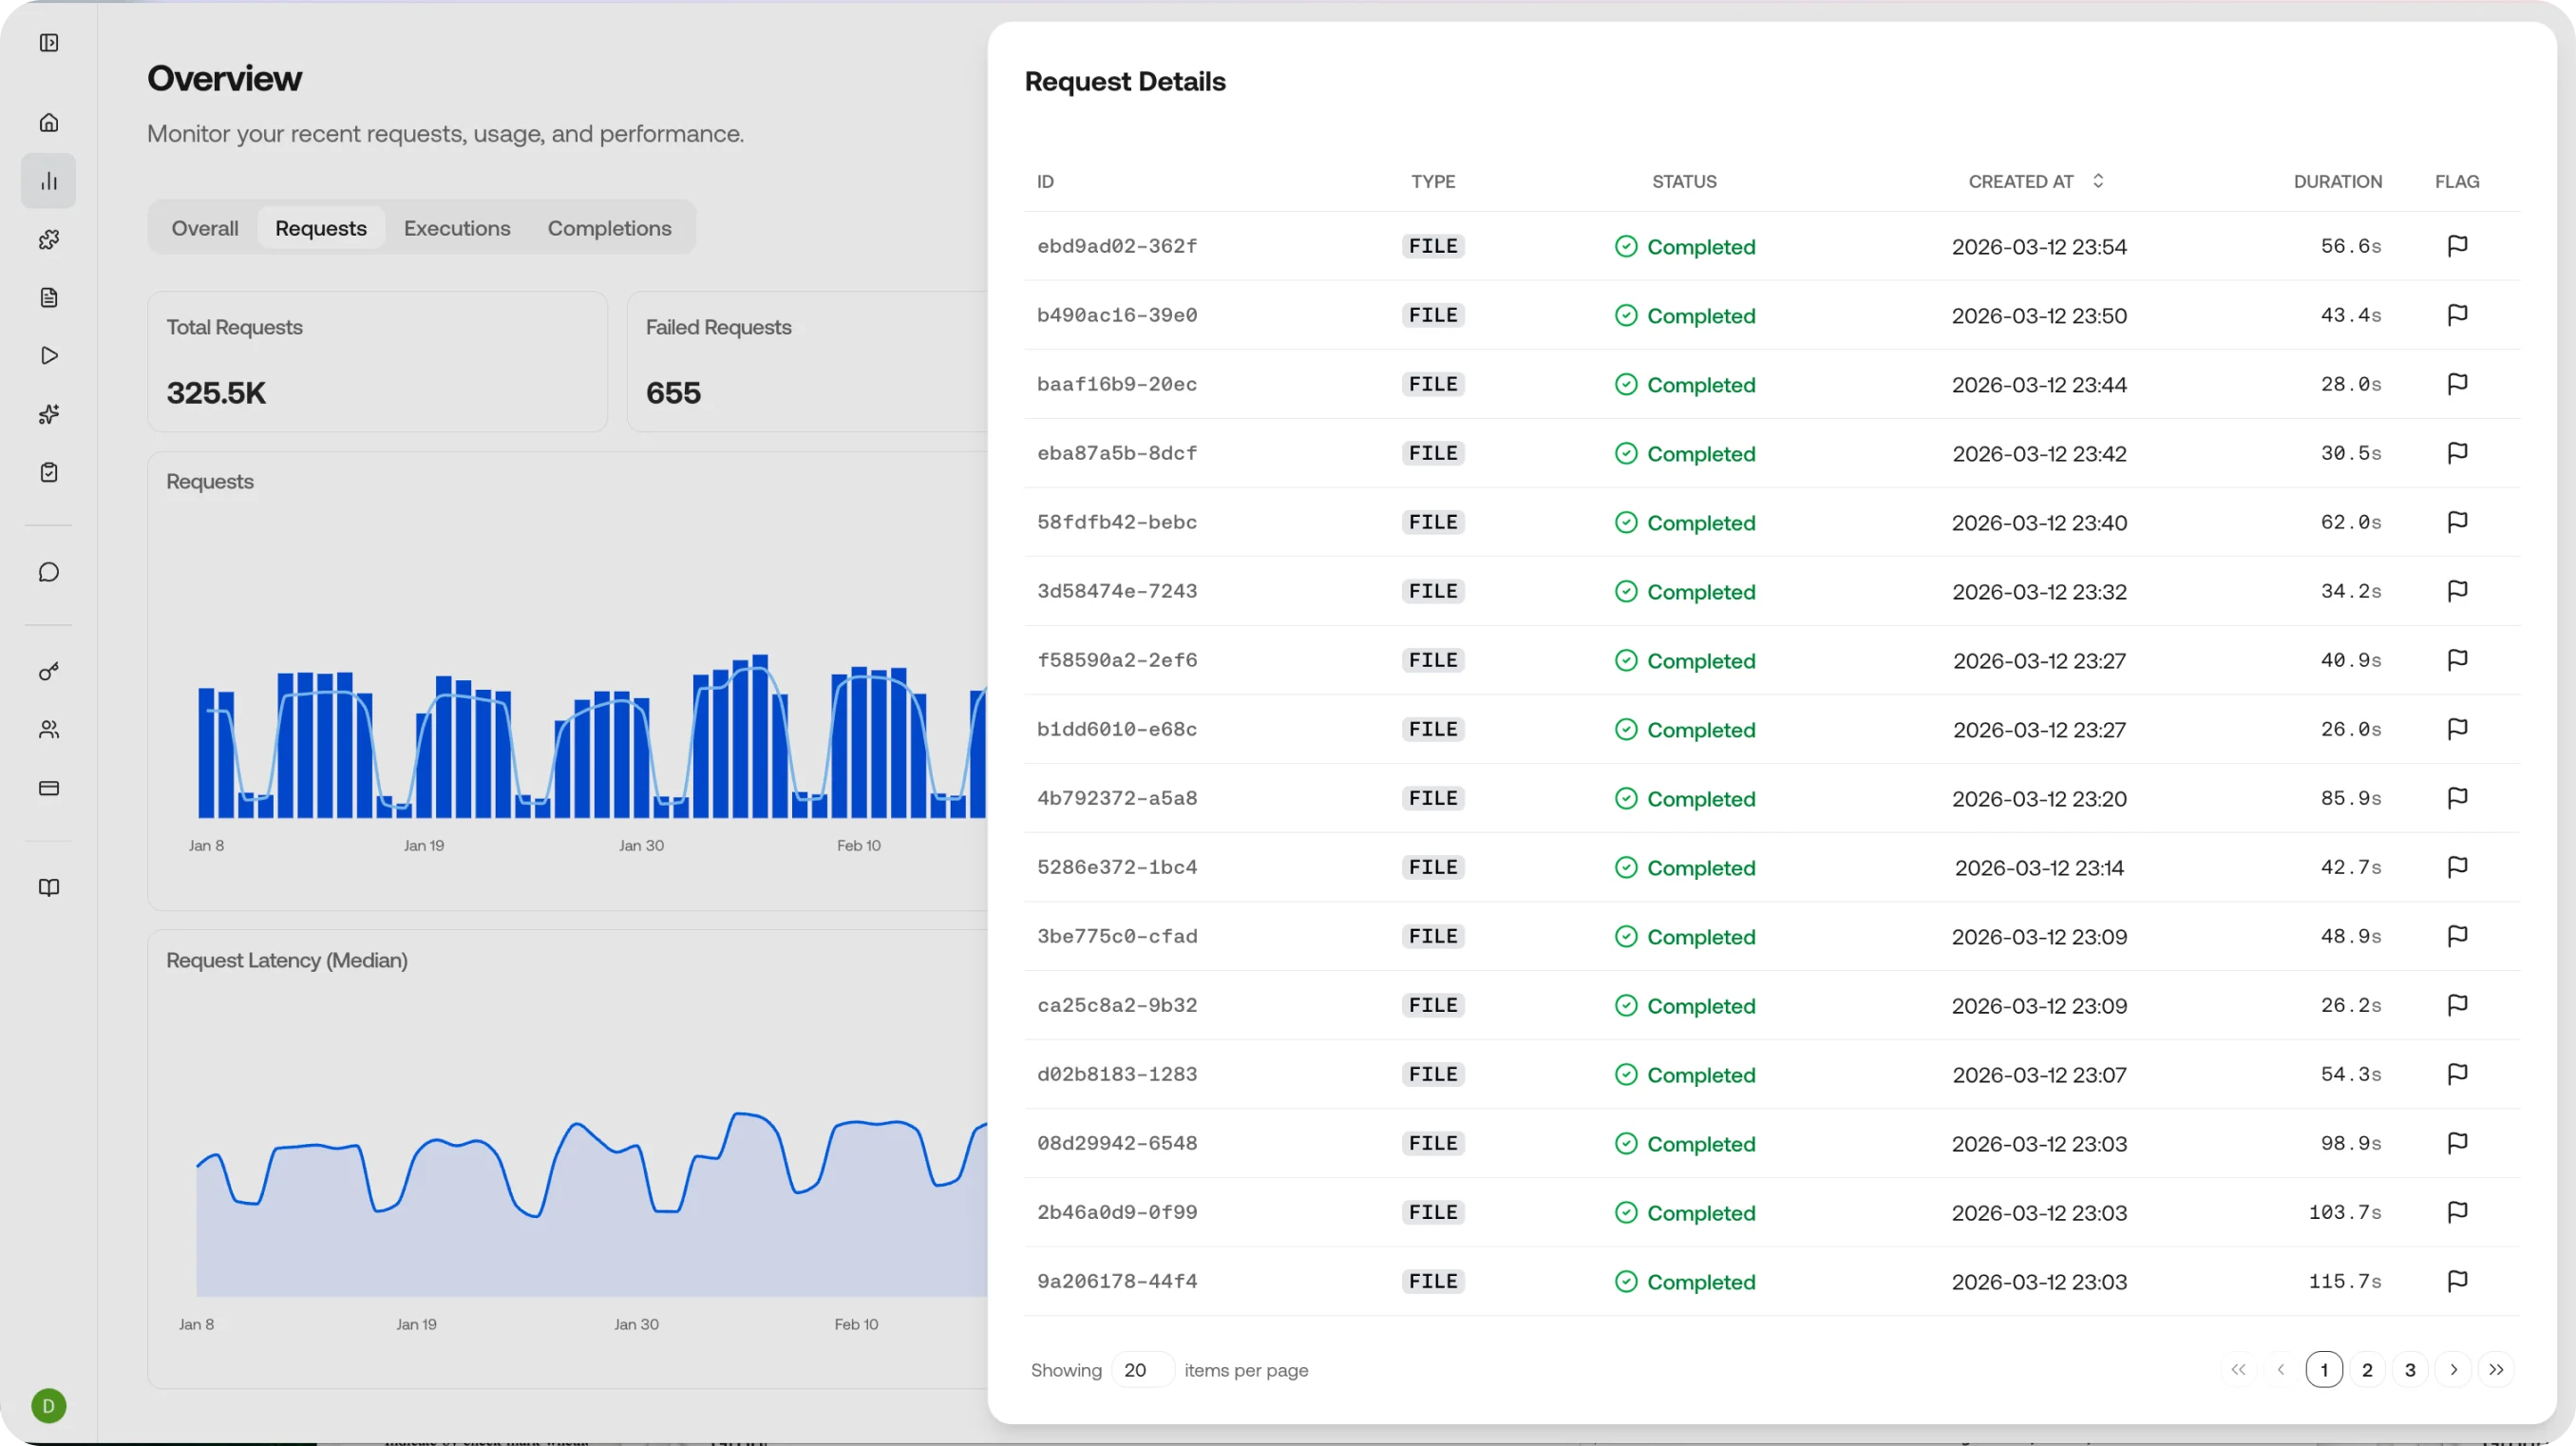
## Filtering
Click the date picker in the top right corner to filter the data to any specific timeframe you want to analyze.
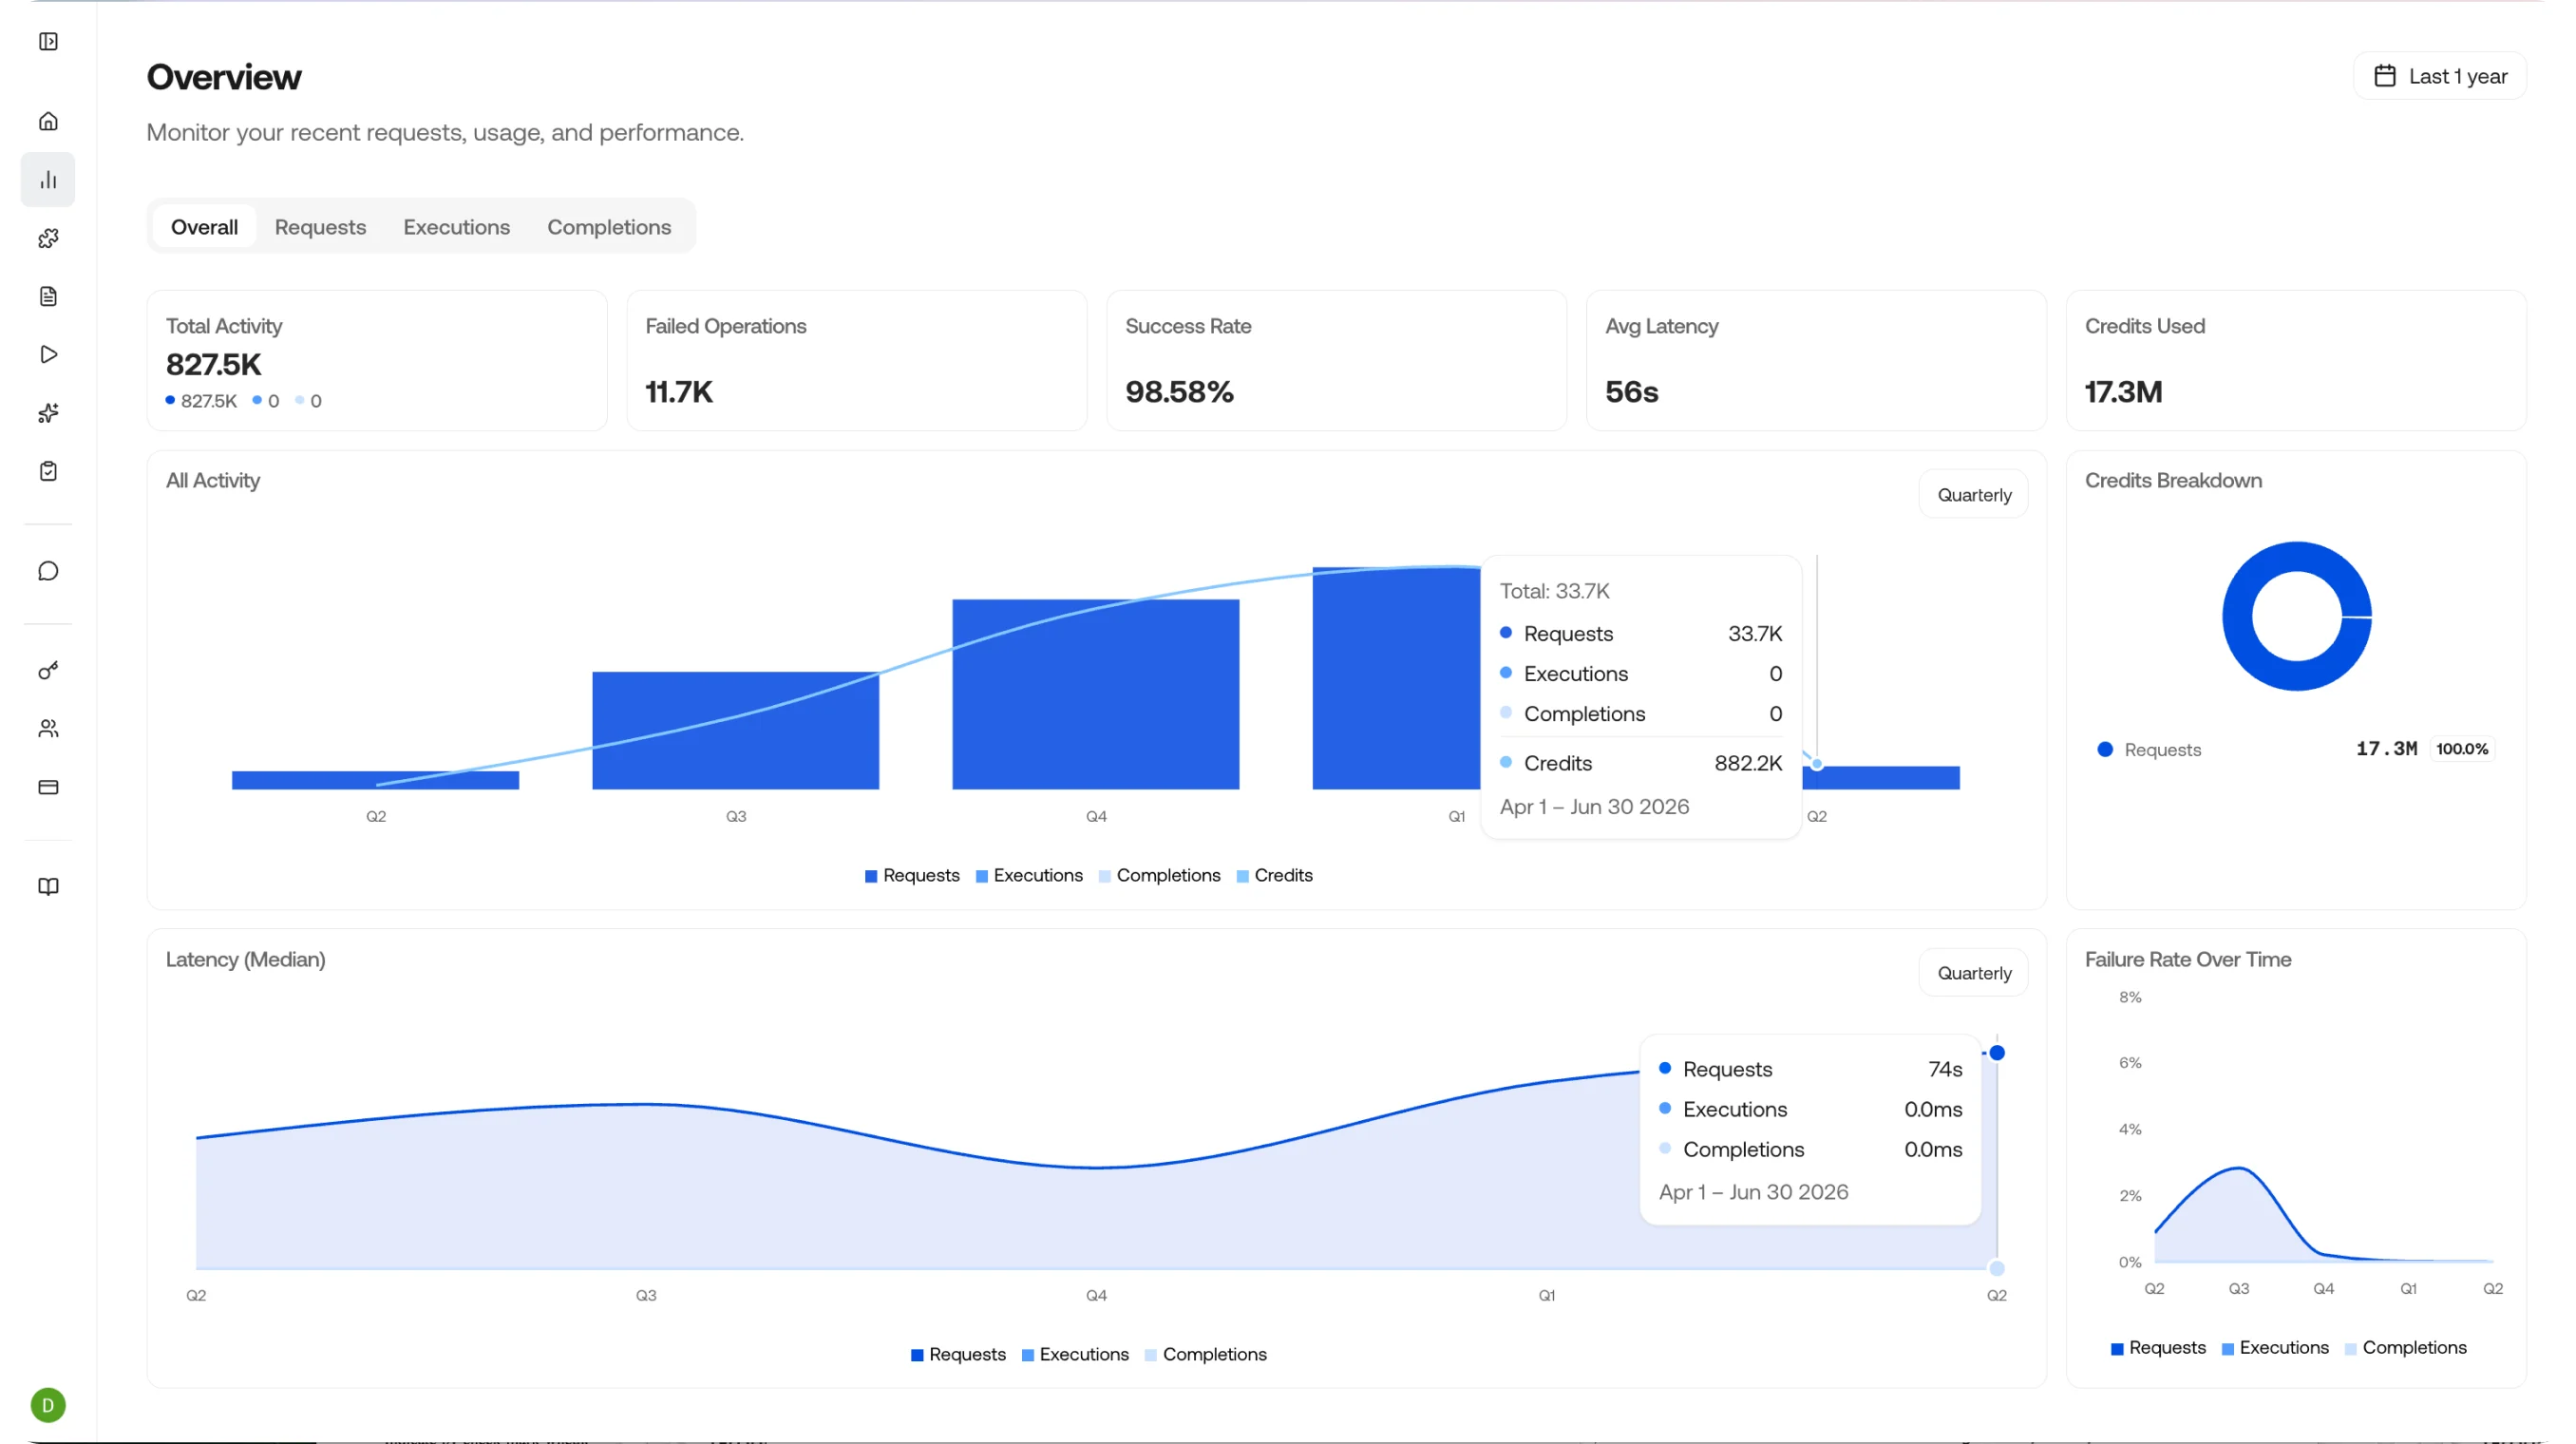
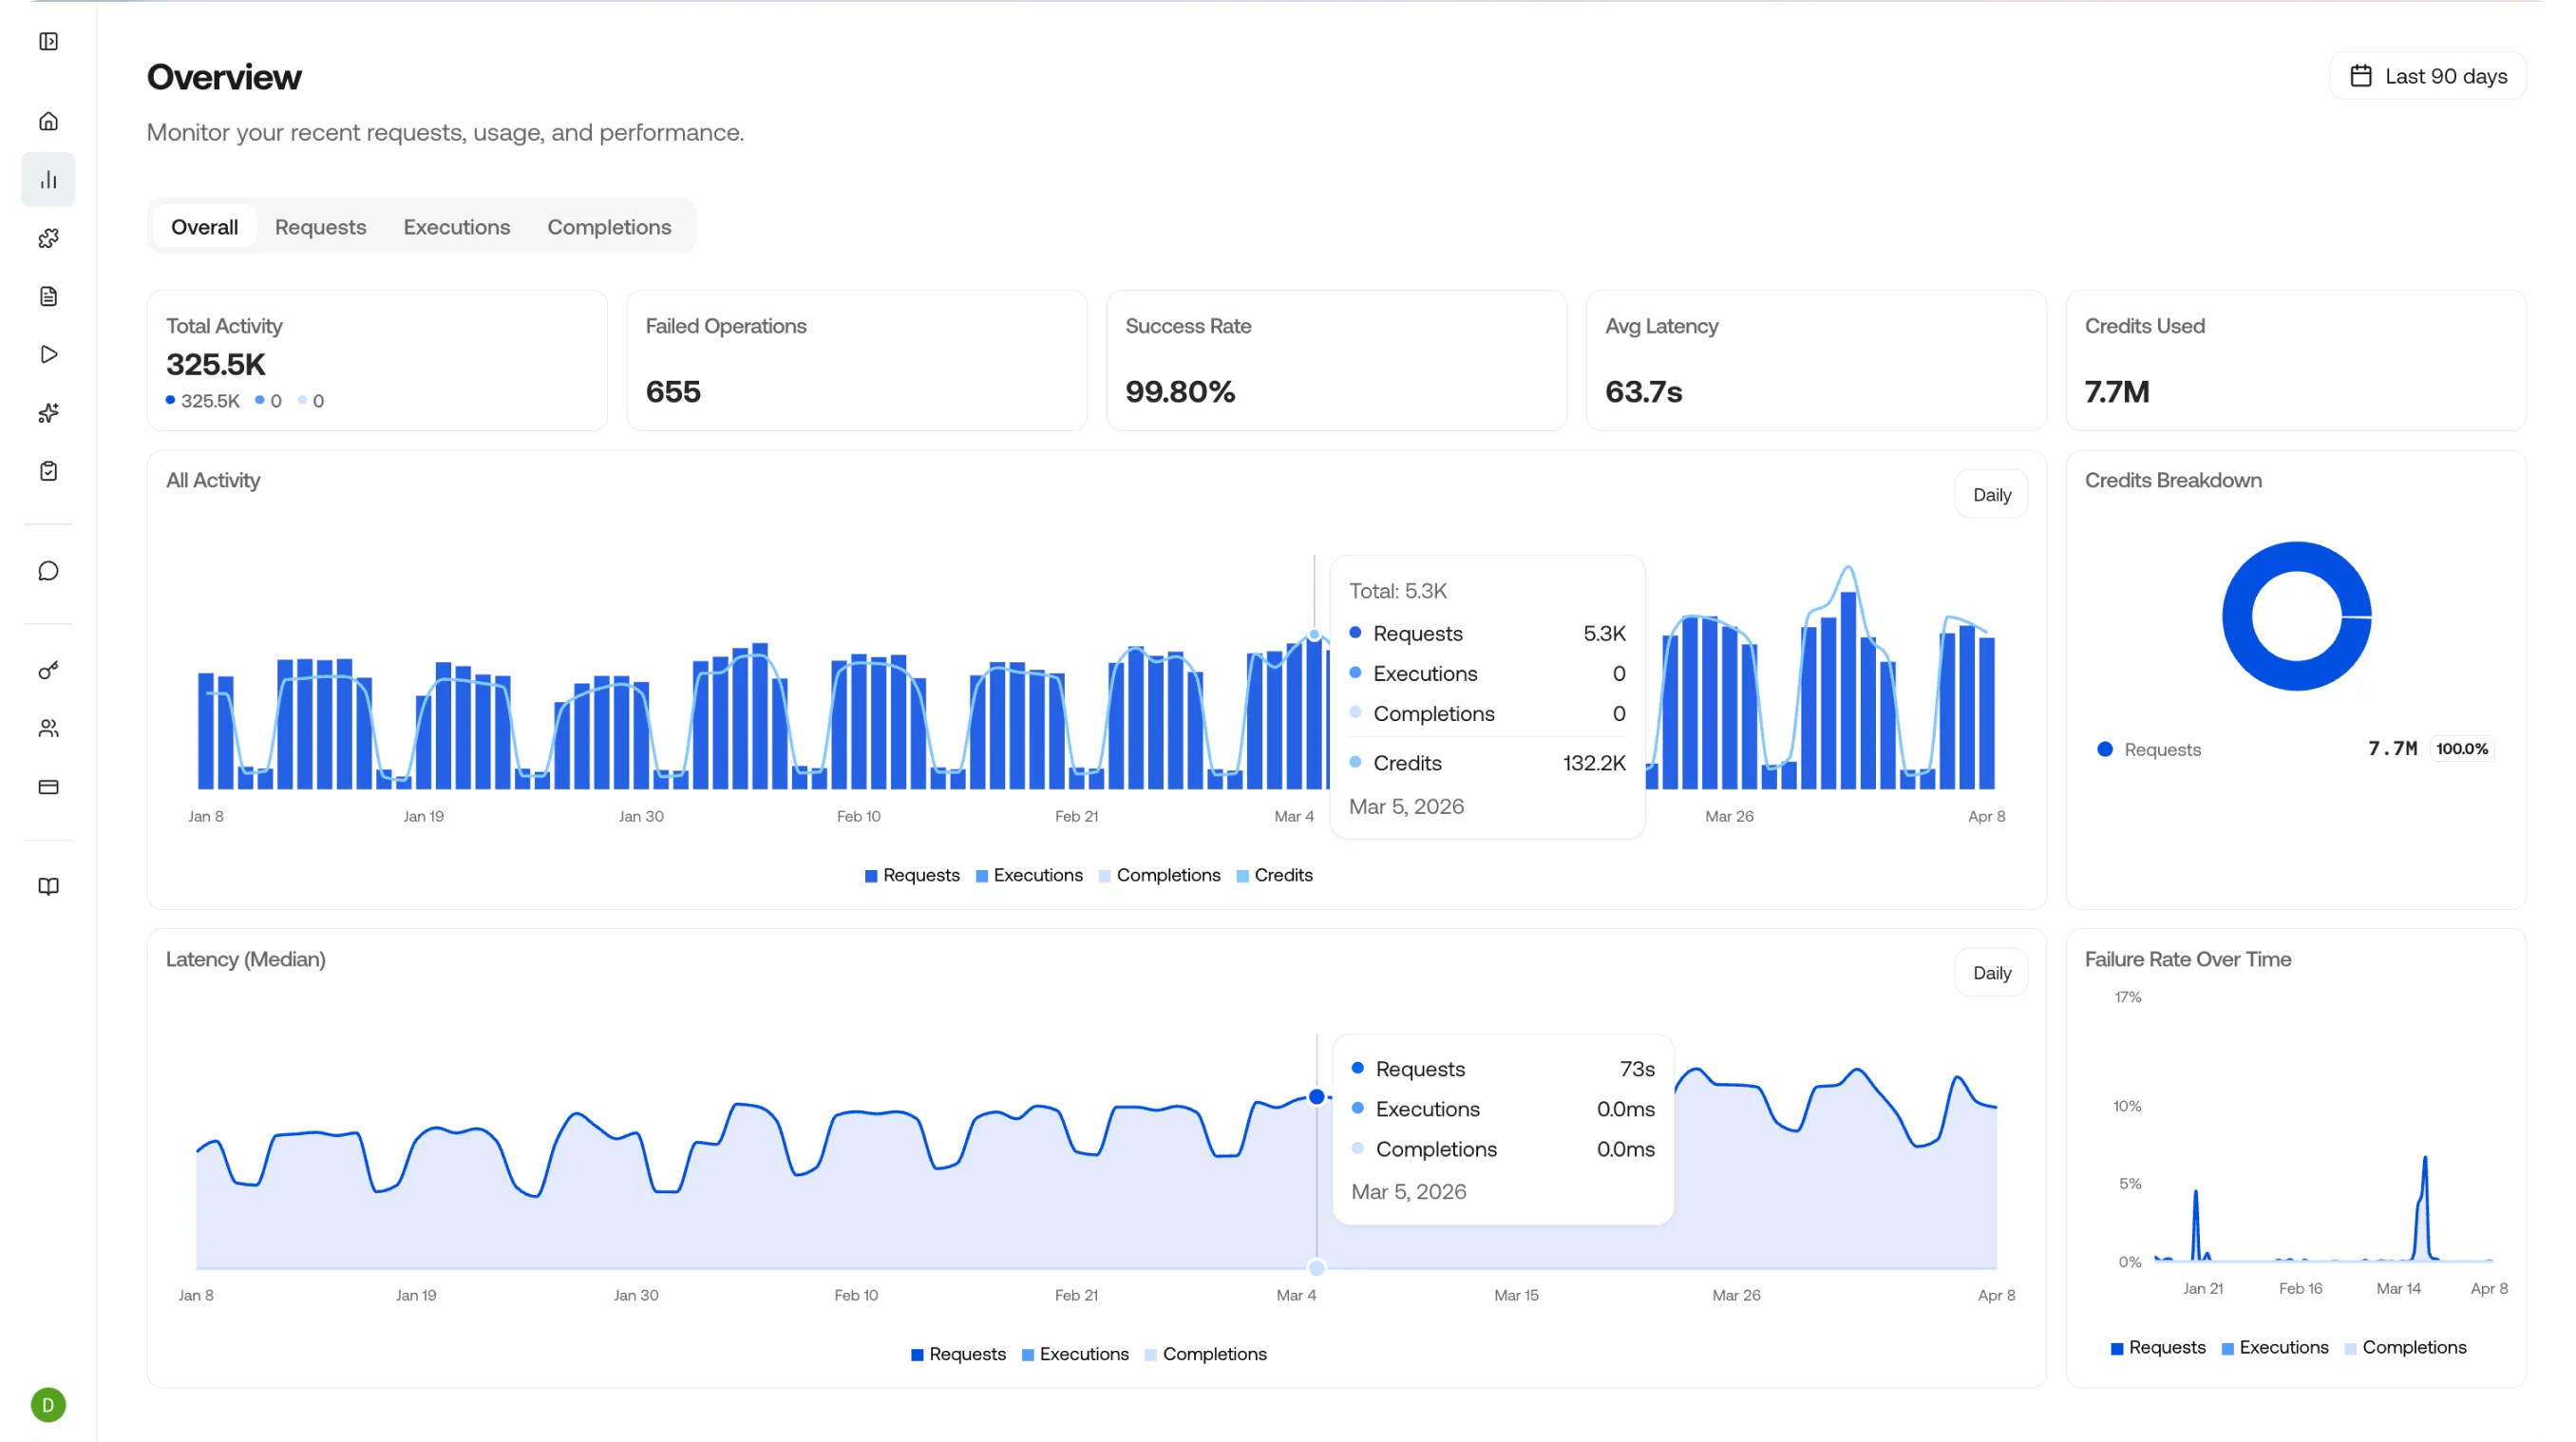
You can also click the grouping button in the top right of the two large charts to change the time grouping - choose from Daily, Weekly, Monthly, Quarterly, or Yearly.
Hover over the chart to see the data breakdown and credits used for each grouped time period.
## Drill Down
Clicking anywhere on a chart takes you to a drill-down view of that data - an easy way to see the requests, executions, and completions that ran during that time period. Clicking an individual item takes you to its details page.
## Dashboard Metrics
The overview page shows four key indicators at a glance:
| Metric | What it tells you |
| ------------------- | ------------------------------------------------------------------------------- |
| **Total Activity** | The number of requests, executions, and completions in the selected time window |
| **Success Rate** | The percentage of calls that completed without errors |
| **Average Latency** | Mean response time across all endpoints, broken down by type |
| **Credits Used** | Total credit consumption with trend over time |
## Three Views, One Story
Observe is organized into three complementary views that let you drill down from high-level metrics to individual outputs:
Model requests with status, duration, and cost.
Agent executions with step-by-step traces, artifacts, and timing.
Chat completions with model, token usage, and the full input and output payload.
## Typical Workflows
Filter Requests by status `error`, find the failing call, and inspect the request payload and error response. Cross-reference with the Completion to see what the model actually returned.
Filter Requests or Completions by skill name to see how many credits each skill is consuming. Identify expensive skills and optimize prompts or schemas to reduce token usage.
Review Completions across different models or skill versions to compare output quality, latency, and cost. Use this to decide when to promote a new skill version to production.
Check the overview dashboard for success rate drops or latency spikes. Set up alerts via webhooks when metrics cross thresholds.
## Related Pages
View and filter individual API requests.
Track agent and skill executions.
Review model completions and outputs.
Run accuracy evaluations from feedback and review field-level metrics.
Explore all available API endpoints and responses.